
Unlocking Data-Driven Success: Navigating The World Of KPIs & KPLs
Data is the heartbeat of successful decision-making. Whether you're running a multinational corporation or a small startup, the ability to harness data effectively can make or break your success. Enter the dashboarding and tracking of Key Performance Indicators (KPIs), the compass guiding businesses towards their strategic goals. But as crucial as KPIs are, many companies find themselves staring at the same high-level metrics, often missing the deeper insights that can truly drive their success. But there’s hope.
The Stacked Affinity Method helps organizations embark on an effective, data-driven journey that truly aligns with business goals, bringing impactful insights to the forefront.
Understanding Key Performance Indicators (KPIs)
Key Performance Indicators are quantifiable high-level metrics that help you measure your business's performance against its strategic goals. They offer a snapshot of how well you're doing and whether you're on track to achieve your objectives. Think of them as the vital signs of your company's health. Your choice of KPIs should always align with your overall organizational objectives.
The Challenge? Moving Beyond High-Level KPIs to KPLs
At a high level, businesses often focus on the same metrics to understand performance, such as revenue growth, net promoter score (NPS), customer acquisition cost (CAC), and lifetime value (LTV), just to name a few. These are all crucial indicators of performance, but the technical landscape has rapidly evolved. We now have access to more data and tools than ever, allowing us to better explore and understand the unique nuances that impact businesses and these high-level KPIs.
What do we mean by Key Performance Levers or KPLs? These are the most impactful, underlying, performance metrics relating to a specific business process supporting the effectiveness or function of one of the KPIs as mentioned above. As a simple example, a KPI for human health is a measure of LDL or bad cholesterol. If we just looked at LDL for a population trended over time against the healthy range, it is interesting to see improvement or change over time but does not tell us much by itself.
This is where the opportunity lies. By having a deeper understanding of what truly impacts your business processes through the related key performance lever insights, organizations can experience high levels of data-driven success. Continuing with the example, instead of just tracking LDL against the goal, determine what the most impactful levers are driving this metric. Performance levers impacting LDL could include metrics such as daily exercise minutes, servings of processed food per day, servings of red meat per week, and hours of sleep per night.
By trending these underlying performance levers over time along with LDL, there will be insights to understand how the sub-level behavior is impacting (levering) the upper-level KPI. Understanding these relationships and their impact on KPIs helps with future performance prediction and new process improvement initiatives impacting the organization’s overall strategic goals.
Real World: Customer Service KPIs & KPLs
An example of the use of KPIs in a customer service center includes first call resolution (FCR) and net promoter score (NPS). While we may be seeing higher or improved FCR, where more customers have their needs met on their first call and generally report a higher NPS score, we should then expect to see this positively impact NPS. What if we are not seeing a positive impact on our NPS from improving FCR?
As we take a deeper look at the KPLs, we can see that even though we are exceeding our FCR goal, there are other downstream implications. The higher FCR is resulting in higher hold times and dropped calls for other customers trying to reach the CX team. These dropped calls then create tickets through other CX channels, and the backlog of work increases. By looking at the Key Performance Levers of the number of dropped calls and the number and aging of CX tickets created, we see a more thorough picture of our overall customer service experience and the impact the KPLs have on the KPIs.
What is the value of having these deeper insights, tying KPLs to KPIs? We can see the relationship and resulting impact each of these levers has on the higher-level KPI to predict and impact future performance as the business evolves.
The Solution To Unlocking Your KPLS? The Stacked Affinity Method
Now, here's where the game-changer comes in – the Stacked Affinity Method for Dashboard Design. Our methodology leverages Six Sigma tools and techniques to develop KPIs and their related KPLs that deeply impact your business processes. It's not just about measuring what's happening; it's about understanding what's influencing your operations.
The Stacked Affinity Method guides you and your teams through the key elements of your underlying business processes impacting your KPIs using the SIPOC method by further defining: Suppliers, Inputs, Processes, Outputs, and Customers. By having stakeholders from various departments involved, this approach ensures that everyone is on the same page. It clarifies roles, responsibilities, and process efficiencies, all while keeping a sharp focus on what customer success means throughout the process.
As a simplified example, let’s look at a web performance process KPI for an e-commerce retailer, average order value (AOV). A simple SIPOC for the web performance process could look as follows:
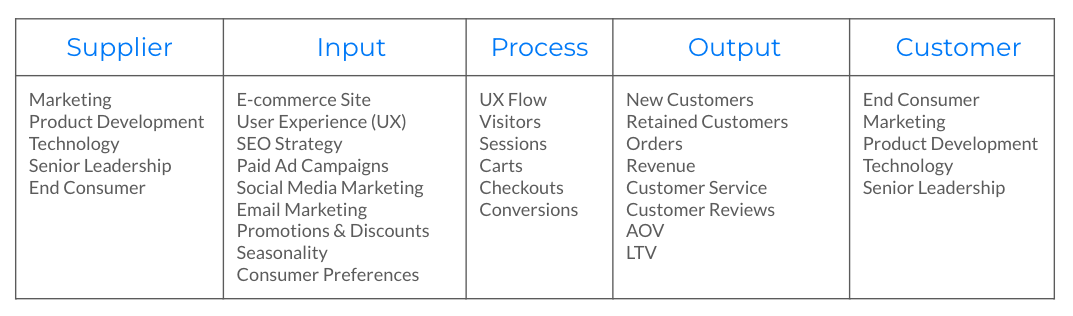
E-Commerce Web Performance SIPOC
Looking at this SIPOC, you can see there are many factors at play impacting average order value or AOV. The technology team needs to make sure the website has quality UX and cart functionality. The marketing team needs to get the awareness out about products and promotions. The product team needs to create products that the end consumer wants to purchase. So, if the technology team’s main KPI is AOV and increasing AOV by, say, 10%, looking at this value trend over time needs to be done in the context of the other sub-metrics or key performance levers impacting AOV.
If we are just tracking AOV over time and see that we are making or exceeding our goal, we may be masking other underlying patterns. We may not see that the number of carts has declined over time along with new customer acquisition. So, while AOV is trending nicely, we are not seeing other aspects of the business eroding which is why tracking these KPLs is so impactful.
Implementing the Stacked Affinity Method can benefit companies in several ways:
Alignment of Stakeholders. By involving all stakeholders in the KPI and KPL development process, everyone is on the same page, eliminating disagreements and misunderstandings.
Clarifying Roles and Responsibilities. This method helps ensure that people are properly aligned and understand their roles in the process, both upstream and downstream.
Identifying Process Efficiencies. It allows you to identify and define success within your processes, improving overall performance as it relates to the overall organizational goal.
Understanding Customer Needs. By aligning KPIs and KPLs with customer requirements, you can ensure that your business remains customer-centric, both internally and externally.
What To Do Now? Encourage Employees To Explore, Discuss, & Lead via Culture
While data-driven decision-making is critical for business success, there is a balancing act between gut instinct and human interaction. While overreliance on data can stifle creativity, acting solely on gut instinct can hinder your ability to adapt to changing market conditions.
To strike the right balance, start bringing people together and use data as the anchor for discussions and decision-making. Foster an open and trusting culture that values both intuition and information. Create a framework that enables a regular cadence of alignment meetings and keeps KPIs and KPLs flexible to adapt to changing circumstances.
Let Us Help You Navigate The World Of KPIs
In summary, KPIs and KPLs are more than just numbers; they are the driving force behind your business's strategic objectives. By understanding the true impact of KPIs and their underlying levers, using the Stacked Affinity Method, and striking the right balance between gut instinct and data, you can navigate the complex world of KPIs and drive your business toward success. Contact us today to learn more about the Stacked Affinity Method for Dashboard Design.